Analytics
The Analytics tab answers questions about your team’s sessions in natural language. Type a question into the “Ask about sessions, tools, evals…” box and Capacitor turns it into a query over your session read model, then replies with a short written answer alongside a table or a chart.
It’s the aggregate counterpart to Session recall: recall pulls back individual sessions, while Analytics rolls many sessions up into a number, a ranking, or a trend.
What you can ask
Section titled “What you can ask”Questions that map to counts, rankings, or time series over sessions, tool calls, tokens, and evaluations work best. For example:
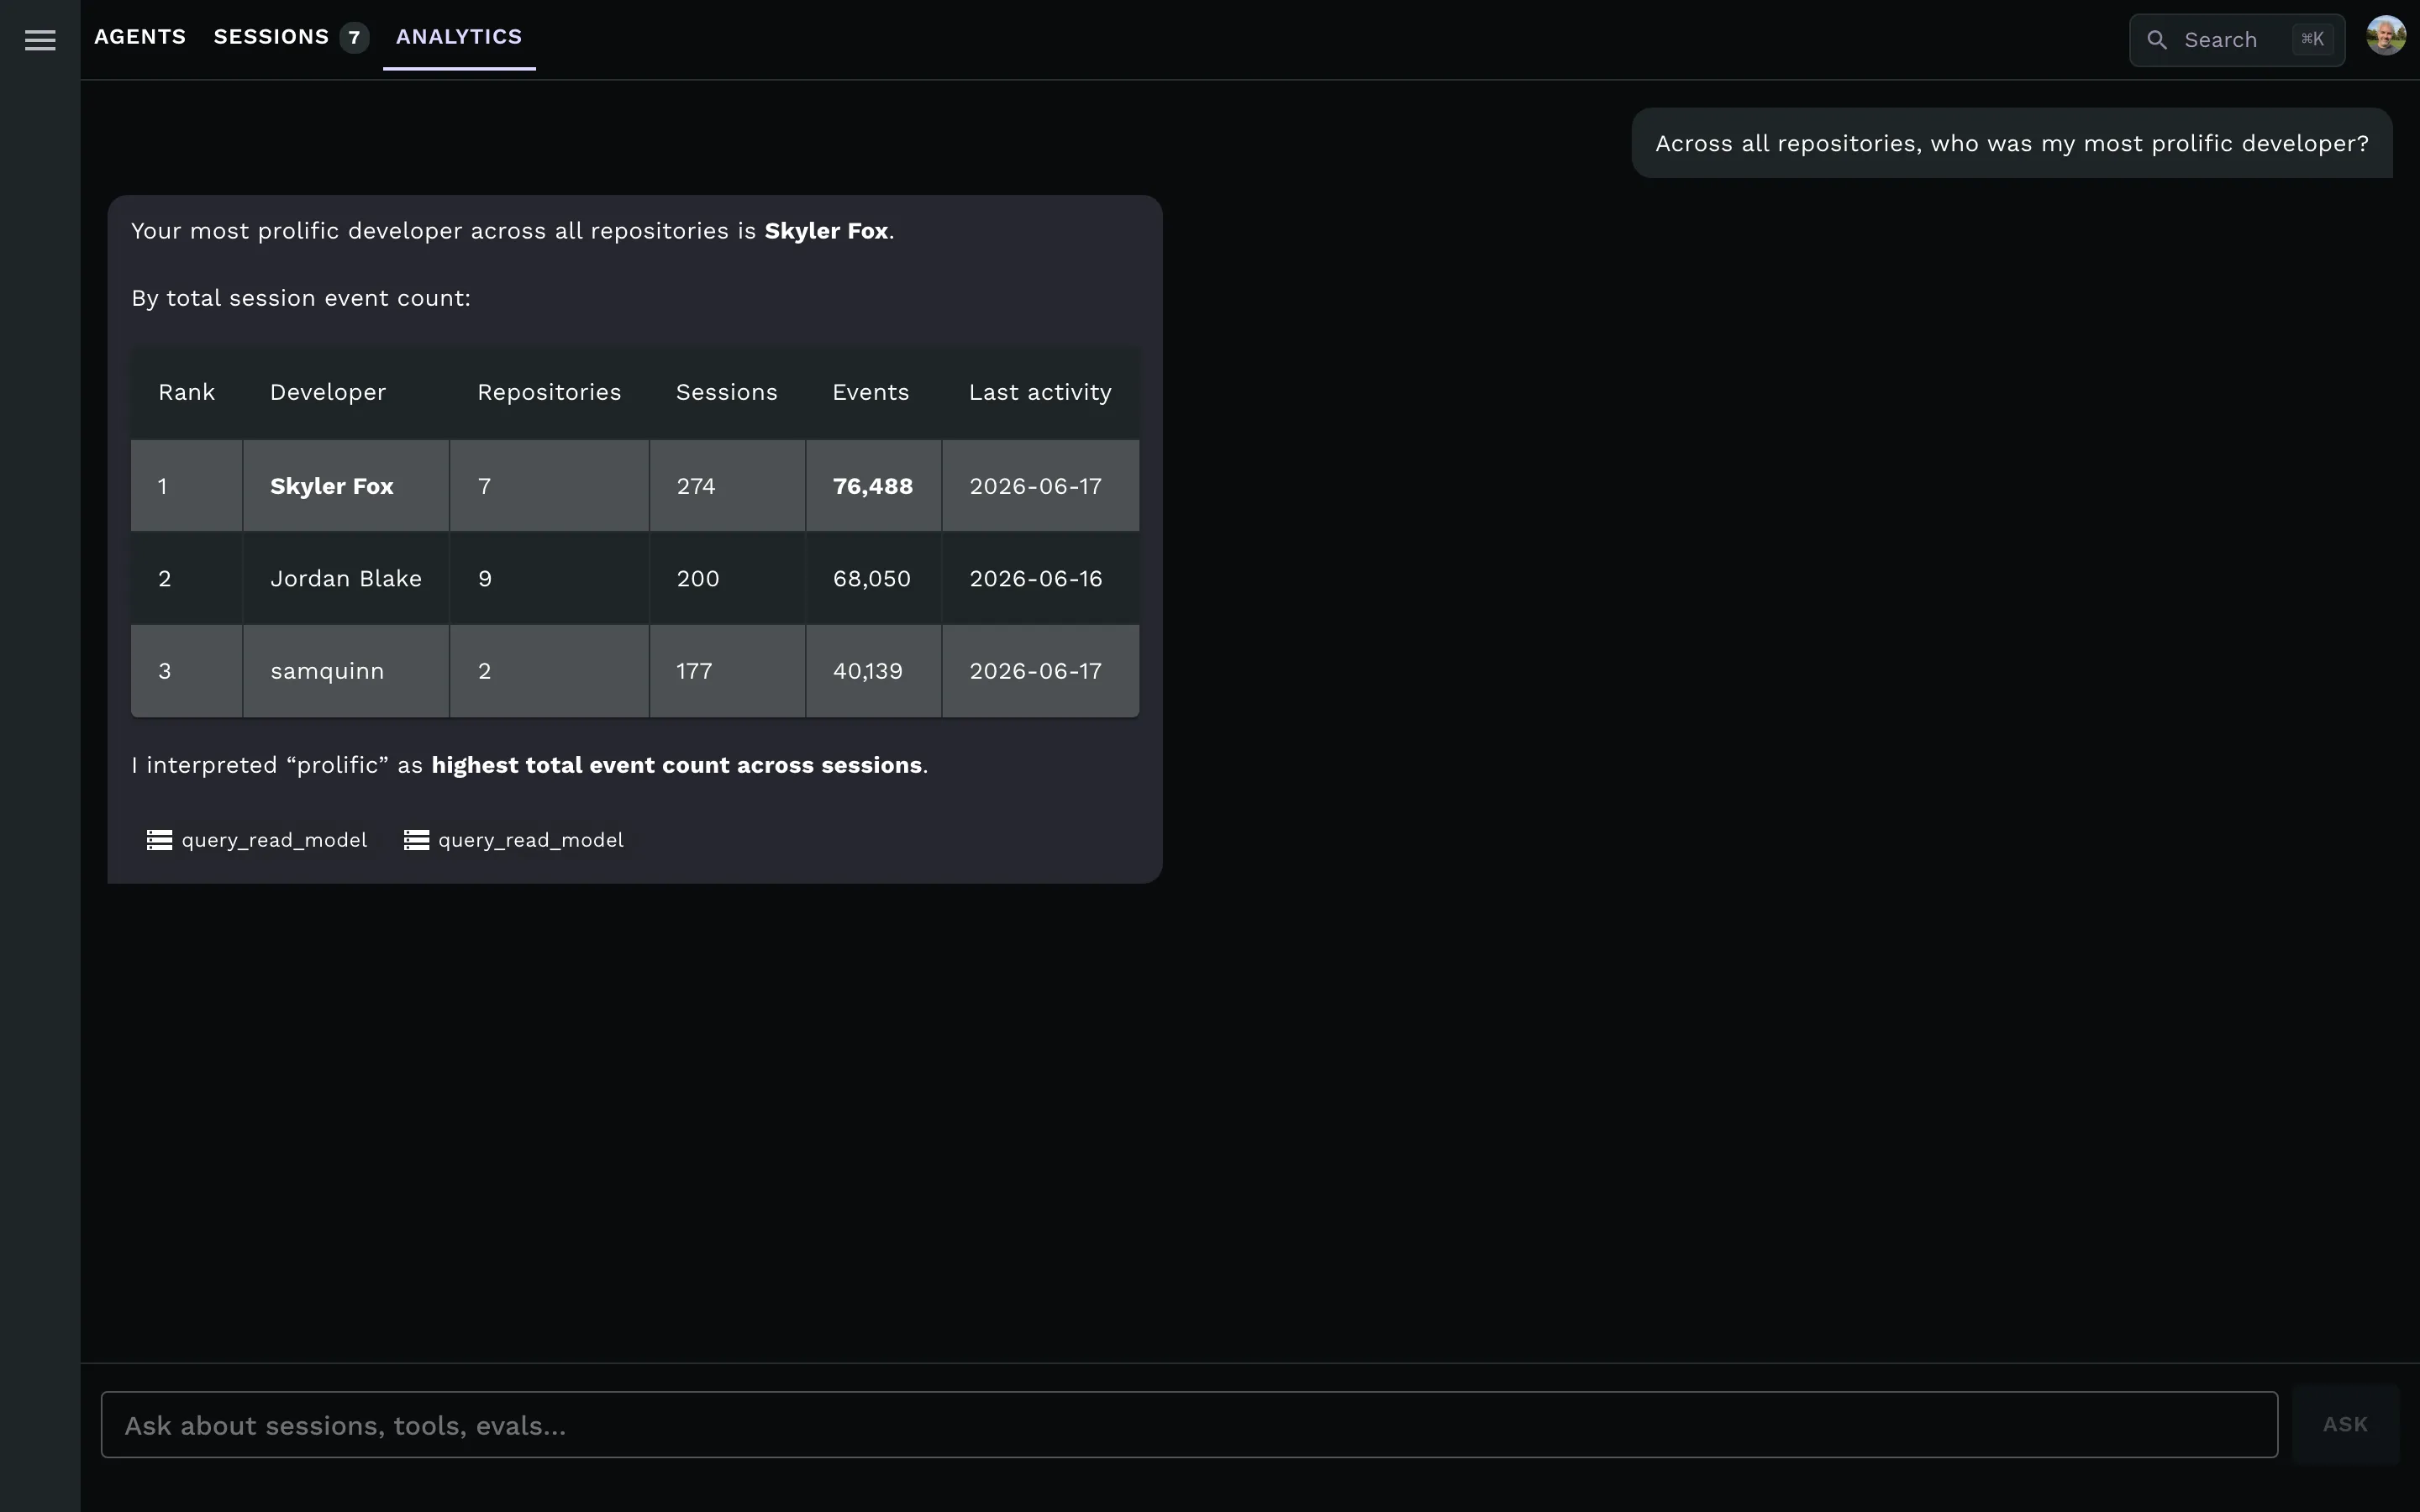
- “Across all repositories, who was my most prolific developer?”
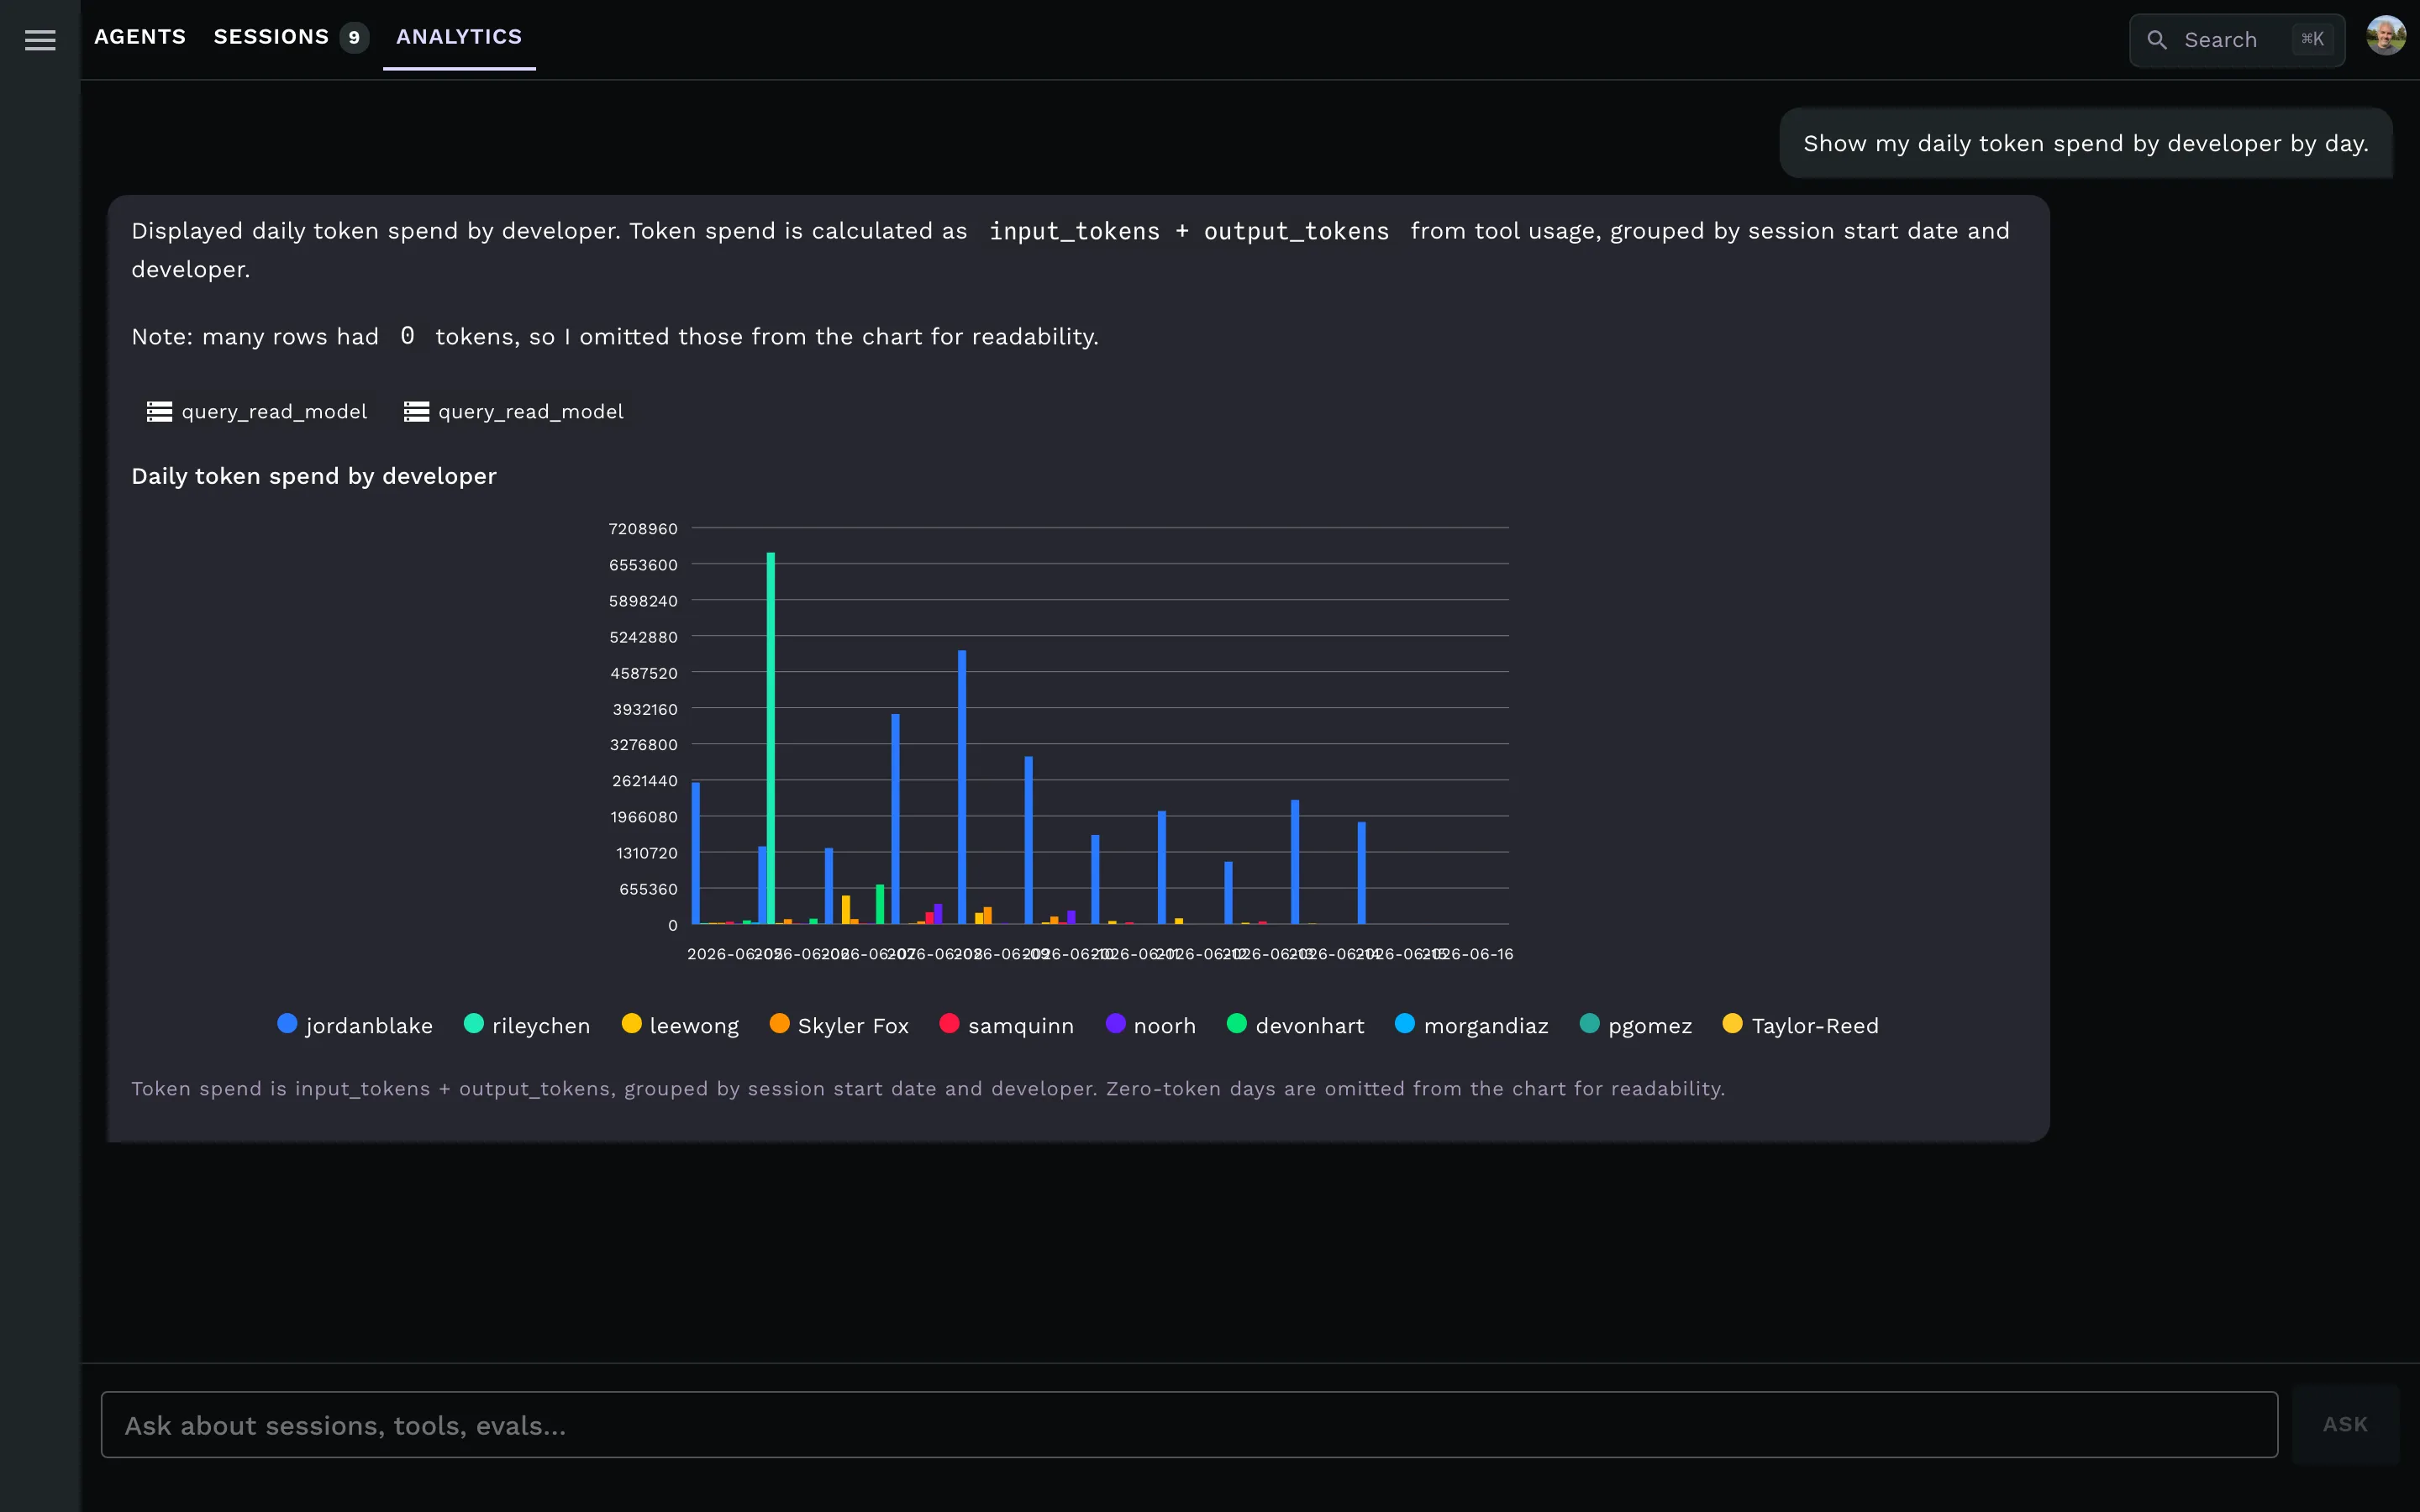
- “Show my daily token spend by developer by day.”
- “Which repositories had the most sessions last month?”
- “Where did tool calls fail most often this week?”
- “What’s the average session length by agent?”
- “What did each repo cost in tokens last month?”
- “Cache vs. input/output tokens by model.”
You ask in plain English — there’s no SQL to write and no columns to pick. Capacitor decides which read-model query answers the question. Cost answers are estimated from token usage priced against models.dev rates; a model with no known rate shows an unknown cost rather than a misleading $0.
What you get back
Section titled “What you get back”Each answer has three parts:
- A written summary — the headline answer in a sentence or two (“Your most prolific developer was … with N sessions across M repositories”).
- The query trace — one or more
query_read_modelchips showing the exact read-model queries behind the answer, so a number is auditable rather than a black box. - A table or a chart — a ranked table for who / which / how many questions, or a bar or line chart for by day / over time questions, with a legend when a series is broken out by developer, repo, or agent.
For example, “who was my most prolific developer?” returns a ranked table of developers by sessions, repositories, and total events; “daily token spend by developer by day” returns a grouped bar chart of input + output tokens per day, one series per developer.
Question history
Section titled “Question history”The clock icon in the chat header opens your question history — every question you’ve asked, newest first, scoped to the current repo (or all repos on the global tab) and private to you. Click a past question to reload it with its saved answer; click the replay icon on a row to re-run it against current data. Within a session, ↑ / ↓ recall your recent prompts the way a shell does.
Copying answers
Section titled “Copying answers”Every answer, chart, and table has a copy button, and each copies in the format you’d actually want to paste:
- An answer copies as rich text — paste it into Google Sheets, Docs, or Excel and its tables land as real rows and columns; paste into a plain-text editor and you get Markdown.
- A chart copies as a PNG image, composited with its title, legend, and caption.
- A table copies as TSV, ready to drop into a spreadsheet.
How it works
Section titled “How it works”Capacitor projects every session’s events into read models in KurrentDB. The Analytics tab runs your natural-language question against those projections via the query_read_model tool and renders the result. Because it reads the same projections that back the rest of the dashboard, the numbers line up with what you see elsewhere — and the same visibility rules apply: Analytics only ever counts sessions you’re allowed to see.
Analytics never sees your transcripts. Questions run only over the aggregate projections — counts, tokens, timings, and structural fields — so no prompt, message, or tool-output text is ever sent to the model. It’s telemetry about your sessions, not their contents.
If a question comes back without a useful answer, try rephrasing it toward a count, a ranking, or a per-day/per-repo/per-developer breakdown — that’s the shape Analytics maps to best.
Related
Section titled “Related”- The dashboard — where the Analytics tab lives.
- Session recall — search and pull back individual past sessions.
- Evaluations — per-repo evaluation trends and scoring.